We’ve covered how to add Google Analytics tracking to your WordPress website. Then in our last post we covered how to configure the MonsterInsights plugin (Formerly Google Analytics by Yoast) on your WordPress website. Now we’re moving right along into Part 2 of our two-part MonsterInsights series. In this post we are going to show you the Dashboard and Reports features from the free version of this great plugin.
The MonsterInsights Dashboard
The beauty of the MonsterInsights plugin is it’s ability to pull the most relevant metrics from Google Analtyics directly into your WordPress admin area. This means you can view your website’s data without having to login to Google Analytics separately. Let’s take a look at what the MonsterInsights Dashboard offers.
 TIP: As we mentioned in our last post, if you are ever looking for more information on a feature or a metric, simply click on the question mark symbol next to each area of the plugin.
The Overview Tab
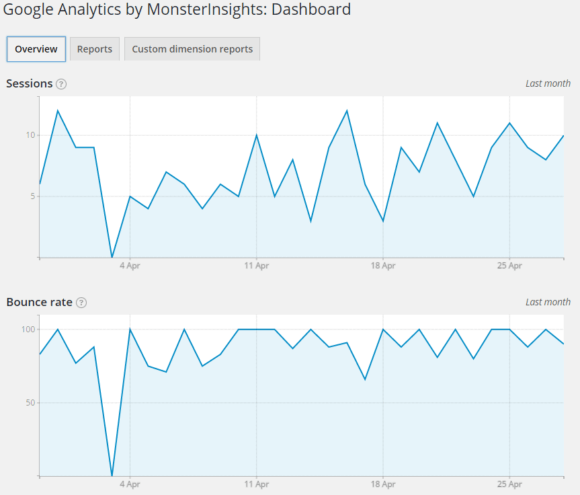
The Overview tab is where you will start when you first go to the Dashboard. Here you will find two very straightforward metrics: Sessions and Bounce Rate.
 Sessions: A Session is a group of interactions that take place on your website. This metric used to be referred to as a “Visit” in Google Analytics. A single session can contain multiple pageviews, multiple clicks, and even multiple conversions or purchases.
Think of it as a bigger picture or “forest” metric, rather than a “tree” metric. Every interaction a visitor has with your website takes place within their single session. This is why there are more pageviews than there are sessions when you are looking at analytics data for a website.
The session metric is great for getting a general sense of how much traffic your website is receiving and is usually the best place to start with analytics.
Bounce Rate: Bounce rate is a percentage measurement of how many times a user viewed only a single page (i.e. the first page they landed on) before leaving the site entirely.
For example, if a visitor finds your website via Google, clicks on your search result, lands on your homepage, and then leaves to go back to Google, that would count as a bounce. Depending on how you have your tracking set up, the length of time the visitor spends on that single page does not matter. Unless they visit a second page on your site, it will count as a bounce.
Bounce rate is a great metric to help you determine if visitors like the experience and content of the first page they land on. While the metric is somewhat useless unless combined with the actual pages and the source of your visitors, it is a good barometer for the overall usability and content quality of your website.
For example, if you know that your homepage has a high bounce rate for visitors that came from a Yellow Pages listing on YP.com, you may want to take a look and see what content or information your homepage may be missing. Perhaps you are missing a phone number or other contact information. Perhaps you are not describing your services clearly enough.
Also keep in mind that, depending on what an individual page is about, a high bounce rate might not be a bad thing. For example, say your “Contact Info” page has a high bounce rate. If that page contains strictly contact information (address, a map, phone/fax number, email, etc.,) then it is likely visitors are landing on the page, getting exactly the information they want, and then bouncing off the site, which is a positive.
TIP: As a general rule, a bad bounce rate is 75% and above, a good bounce rate is 50-75%, and anything below 50% means you are doing well.
The Reports Tab
 The reports tab offers you three different kinds of traffic dimensions: Traffic Sources, Popular Pages, and Countries. Each one is accessed via the “Select a dimension” dropdown.
TIP: When it comes Google Analytics, remember that a “Dimension” often refers to a name, while a “Metric” refers to a numerical value. For example, if your website has had 100 Sessions from Search Engines, “Sessions” would be the metric, and “Search Engines” would be the dimension.
Traffic Sources Report
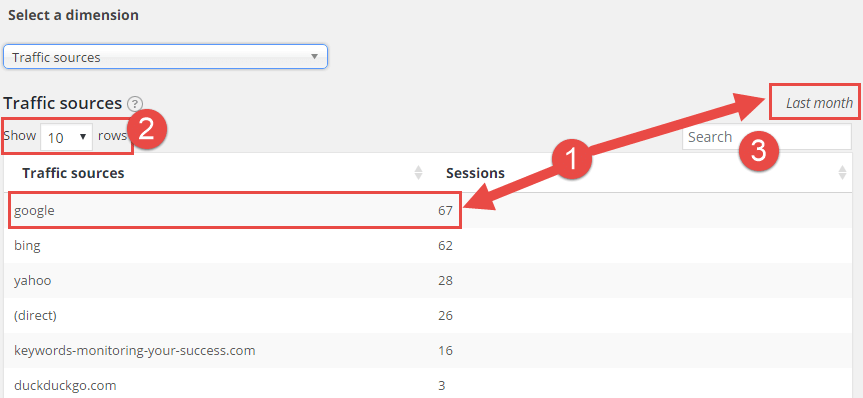
The “Traffic Sources” report shows you the various traffic sources for your site and their respective session counts. This data is useful because it is important to know what source is driving the most traffic to your site.
You are likely to see search engines at the top of this list, simply because they are likely including your website in search results for particular keyword searches, thus driving traffic to your site.
 Other sources might include websites that have a link to your site on one of their pages. If you see a website you don’t recognize, try looking it up to see if it seems like a legitimate website and link. Often spammers will create links to websites that can skew your traffic data.
If you begin to see a lot of these spammy or unrecognizable sites driving traffic to your site, you may want to consider filtering their data out in Google Analytics. You can learn about how to set up a filter here, though we recommend you get in touch with someone familiar with Google Analytics.
Below is an explanation of the Traffic Sources report features:
- In the screenshot you can see that Google drove 67 sessions to the website last month.
- You can expand the list to show more rows.
- You can also search for a traffic source if you are looking for one in particular.
 Popular Pages Report
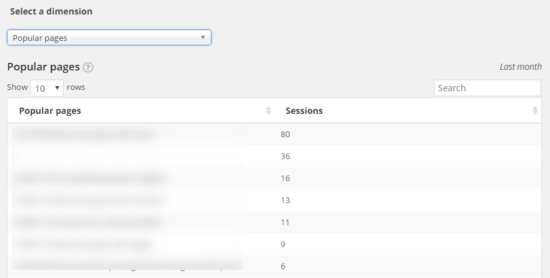
The “Popular Pages” report shows you just that. The most popular pages on your website based on number of sessions.
The URL of each page is shown and you can search and sort in exactly the same way as the Traffic Sources report.
This data is useful because it shows you which content on your website performs strongest. If you begin to notice certain pages focused on particular topics driving a majority of your traffic, you may want to consider creating similar or related content.
Countries Report
This report is extremely straightforward. It provides you with the countries that drove traffic to your website.
Honestly, this data is not very actionable. However you can take note of any countries you do not want to receive traffic from and then work to block that country’s traffic using an IP blocker.
Wrap Up
The current reporting options in MonsterInsights are fairly limited at the moment, though the data provided is enough to give you a sense of how your site is performing overall. As we mentioned in previous posts, MonsterInsights was formerly known as Google Analytics for WordPress by Yoast but was recently acquired by Syed Balkhi, creator of the OptinMonster and WPForms WordPress plugins.
Thanks to that acquisition, we are looking forward to some added functionality and options in the MonsterInsights plugin in the near future. Of course, if you would like to experience more features from the plugin right now, consider purchasing the Pro version, which includes several additional features to help you monitor your website’s performance.
Happy Tracking!

Hello WP 101 Team!
My company has recently switched from Jonas to WordPress (yay) so I am super excited to have more user-friendly analytics capabilities. We have installed the free version of MonsterInsights and I was hoping you could help clarify a few of the reporting capabilities:
1- Does the traffic sources report only show data for the “last month” and am I able to define the time period or is this a customizable feature that is only available in the paid version?
2 – When reviewing the most popular pages the first result simply shows as “/” – do you know if this is referring to our homepage or is there an error I should be contacting the administrator about?
3- Do you know if the paid version allow me to download or export this data?
I’ve been hard pressed to find a more comprehensive user guide on the MonsterInsights website so your articles have been wonderfully helpful in helping me navigate this new territory.
Thank you so much for your guidance and assistance.
Hi there,
I’m the lead developer of MonsterInsights
1- Does the traffic sources report only show data for the “last month” and am I able to define the time period or is this a customizable feature that is only available in the paid version?
This is not available yet, but will be some time this year in our Pro version.
2 – When reviewing the most popular pages the first result simply shows as “/” – do you know if this is referring to our homepage or is there an error I should be contacting the administrator about?
This is the homepage of your site
3- Do you know if the paid version allow me to download or export this data?
Not currently, but it’s something we’re looking at for later this year
-Chris
Hey I downloaded monster plugin through google analytics for my new site yesterday. I have gone through the entire process and in my “insights” dashboard it says “If you’ve just installed MonsterInsights, data may take up to 24 hours to populate here. Check back soon!” but it has been more than 24 hours now. Any tips??
Thanks